SoCal Multifamily Sales Pulse - July 3, 2022 - July 9, 2022
Disclaimer: All information contained herein is obtained from sources believed reliable. We have not verified it and make no guarantee, warranty or representation about it. Any projections, opinions, assumptions or estimates used are for example only. We make no claim(s) as to the accuracy or reliability of the information presented. If you wish for us to analyze your specific property or situation please feel free to call or email us anytime.
Here's What's Happening In The Market, Here’s What This Means For You
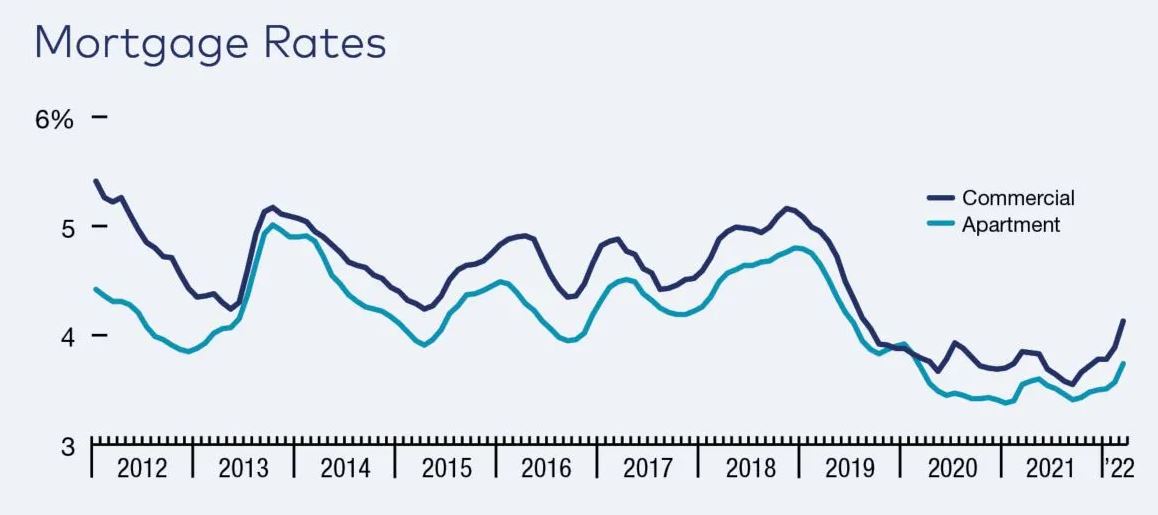
After two years in which the Federal Reserve expanded the U.S. money supply by an astounding 410% and kept interest rates at near zero to prop up the economy, the U.S. central bank is striving to battle inflation that has hit a 40-year high. That raises a pivotal question: Will those inflation-fighting efforts help or harm multifamily lending, investment and development?
The Fed’s tightening, which began in March, had little effect on the red-hot multifamily sector in the first quarter, when buyers sank $63 billion into apartments, a 56 percent year-over-year increase and the strongest first quarter on record. But since then, lenders and investors have become more cautious.
During the first quarter, investors were eager to refinance in order to take advantage of high valuations and to get in the market before the Fed started hiking its benchmark interest rate to ease inflation. Now, many are hesitant to tap the debt markets because interest rates have risen so rapidly since March, and lender underwriting is reflecting economic uncertainty and increased risk. There is even talk of “negative leverage” for some properties if the cost of capital is higher than a property’s cap rate.
In previous periods of rising interest rates, lenders typically kept the cost of capital relatively stable by narrowing the spread above whatever benchmark rate was being used. Today, however, lenders either have moved to the sidelines or are pricing more risk into deals.
Click Here To View Current Interest Rates
THE PULSE OF THE MARKET
The market is going through a correction right now. The question is how big will the correction be. There’s talk of a three-quarter percent interest rate increase this month and I’ve even heard that the increase could be as high as 1 percent. That changes things dramatically. The psychological effects of a 1-point increase will cause a pullback from most investors. It may cause a lot of investors to adopt a wait-and-see attitude on the market.
WHAT TO EXPECT
I’m expecting at least a three-quarter percent interest rate increase at the next Fed meeting. Inventory will continue its slow but steady increase and we’ll start to see fewer transactions. Days on market will also continue it’s slow but steady increase. We have yet to see values drop much but I expect we will see values start to drop the further we get into the correction cycle and interest rate increase. As always, feel free to give me a call or send me an email with any questions on the market.
The way to increase your wealth is to sell at the current historically high prices and find alternative investments where you can get as high or more passive returns and continue to increase your wealth. Let me know if you’d like to have me analyze your situation and property to help determine your equity position for a potential sale or 1031 exchange. All right, that’s it for now, see ya next week.
Orange County
Click Links
below to view the Orange County
Closed Sales from last week
Live MLS Link expires in 30 days after published

Long Beach
Click Links
below to view the Long Beach
Closed Sales from last week
Live MLS Link expires in 30 days after published

Los Angeles County
Click Links
below to view the Los Angeles County
Closed Sales from last week
Live MLS Link expires in 30 days after published

San Diego County
Click Links
below to view the San Diego County
Closed Sales from last week
Live MLS Link expires in 30 days after published

Riverside County
Click Links
below to view the Riverside County
Closed Sales from last week
Live MLS Link expires in 30 days after published

San Bernardino County
Click Links
below to view the San Bernardino County
Closed Sales from last week
Live MLS Link expires in 30 days after published

Comments
No comments.
Register here or Login here to be able to add comment.








