SoCal Multifamily Sales Pulse - May 29, 2022 - June 4, 2022
Disclaimer: All information contained herein is obtained from sources believed reliable. We have not verified it and make no guarantee, warranty or representation about it. Any projections, opinions, assumptions or estimates used are for example only. We make no claim(s) as to the accuracy or reliability of the information presented. If you wish for us to analyze your specific property or situation please feel free to call or email us anytime.
Here's What's Happening In The Market, Here’s What This Means For You
Historical Data of Recessions and Interest Rate Increases
Historical data shows a rise in interest rates of more than 2.5 percentage points above the previous cycle-average level typically triggers a recession. It takes around three years from the first Fed hike to enter a recession, according to 70 years of data on rate increasing cycles crunched by Deutsche Bank.
The near zero rates of the past five years mean that once short-term rates rise above 2.5% to 2.75%, a mild recession is likely to occur. If interest rates were to rise above a 2.5%-to-2.75% range in 2023, particularly if inflation expectations begin to fall, then there would be a pronounced impact on the economy. The Fed doesn't believe that interest rates need to rise above that 2.5% to 2.75% level, but many economists do.
Interest rates usually fall in a recession as loan demand declines and investors seek safety.
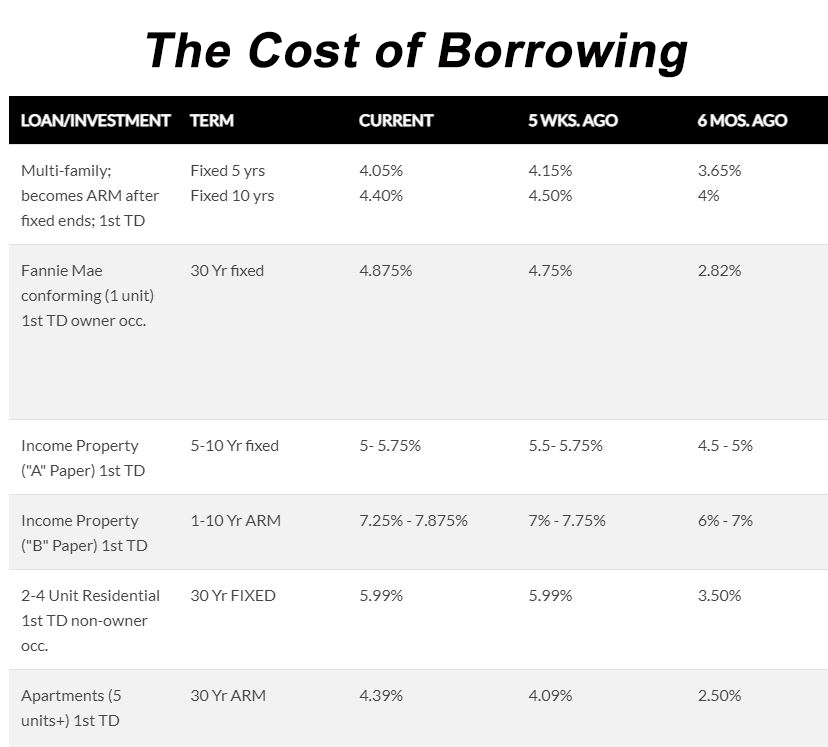
The Pulse of the Market
As expected inventory increased again last week. Sellers are putting their property on the market hoping to take advantage of the last bits of the hot market that we experienced over the last couple years. We’re starting to see an increase in the number of price reductions and deals coming back on the market as buyers get cold feet or can’t qualify at the higher interest rates.
WHAT TO EXPECT:
We should see the current seller’s market move a little bit toward a buyer’s market as we move through the rest of 2022. This will hopefully give more balance to the market. Inventory should continue to increase which should contribute to the balance of the market. There will still be a strong demand for So Cal multifamily as it remains a solid investment. We should also see some of the inexperienced syndicators leave the market as profit margins get squeezed.
Orange County
The Orange County monthly Absorption Rate went from 2.18 months to 2.37 months. Looking at the monthly charts the Days to Sell Average remained the same as the previous month at 22 days. The Number of Active Listings has seen an increase over the last 2 months. The Number of New Listings per month was the same as last month with 91 new listings. The Average Price Per Sq. Ft. has seen a decrease over the last 2 months after increasing each month over the prior 6 months. The Number of Sales last month increased as it continued it’s trend of up and down each month over the last 12 months.

Live MLS and Sale of the Week Link expires in 30 days after published View Live MLS Data View PDF Version
Long Beach
The monthly Absorption Rate for Long Beach moved up from 2.6 months previously to 3.18 months currently. For the monthly stats the Days to Sell Average was up last month to 31 days but still sits at a pretty low time frame. The Number of Active Listing moved up again last month as the trend has been increasing over the last couple months. The Number of New Listings was up again last month as the trend here has been upward three out of the last four months. The monthly Number of Sales dropped for the second consecutive month.

Live MLS and Sale of the Week Link expires in 30 days after published View Live MLS Data View PDF Version
Los Angeles County
Los Angeles County multifamily monthly Absorption Rate moved up from 3.48 months previously to 3.9 months currently. The Days to Sell Average continued its monthly decline over the past 3 months and matches the lowest point over the last 4 years at 39 days. The Number of Active Listings continued its monthly increase and has now increase each month over the last 5 months. The Number of New Listings was down just slightly and has remained about the same over the last 3 months. The Average Price Per Sq. Ft. continued its gradual monthly increase and is now at $517 per sq. ft. The Number of Sales dropped for the second consecutive month.

Live MLS and Sale of the Week Link expires in 30 days after published View Live MLS Data View PDF Version
San Diego County
San Diego County’s multifamily monthly Absorption Rate went from 1.93 months previously to 2.25 months currently. The monthly charts show the Days to Sell Average moving up to 19 days after hitting its lowest point ever in the prior month. The is still the fewest Days to Sell Average out of any area in Southern California. The Number of Active Listings was basically unchanged from the prior month. The Number of New Listings took a significant drop last month and has fallen over the last 2 months. The Number of Sales was down last month but still about the same as its been historically except for the late summer and fall of last year when there was the highest number of sales ever.

Live MLS and Sale of the Week Link expires in 30 days after published View Live MLS Data View PDF Version
Riverside County
Riverside County multifamily monthly Absorption Rate was twice as high as the previous month. Moving from 2 months previously to 4.18 months currently. Looking at the monthly charts, the Days to Sell Average was down last month and is at the third lowest point ever. The Number of Active Listings increased slightly and is still at the lower end of the number of monthly listings that we’ve seen over the last couple of years. The Number of New Listings was down from the previous month but remained at about the average we’ve seen over the last 6-9 months. The Average Price Per Sq. Ft. for the third time out of the last 4 months. The monthly Number of Sales dropped back down to 22 total sales and was at the third lowest amount ever outside of the COVID 19 months in 2020.

Live MLS and Sale of the Week Link expires in 30 days after published View Live MLS Data View PDF Version
San Bernardino County
San Bernardino County’s multifamily monthly Absorption Rate increased from 1.81 months previously to 2.62 months currently. Looking at the monthly charts the Days to Sell Average dropped to the second lowest ever at 29 days. The Number of Active Listings increased only slightly from 460 to 468 listings. The Number of New Listings was up last month after being flat in the prior 2 months. The Number of Sales dropped last month and is near all time lows outside of the COVID 19 months in 2020.

Live MLS and Sale of the Week Link expires in 30 days after published View Live MLS Data View PDF Version
Comments
No comments.
Register here or Login here to be able to add comment.








